For scientific and political disputes, see Global warming controversy, Scientific opinion on climate change and Public opinion on climate change.
For past climate change see Paleoclimatology and Geologic temperature record. For the Sonny Rollins album see Global Warming (album).
For past climate change see Paleoclimatology and Geologic temperature record. For the Sonny Rollins album see Global Warming (album).
Line plot of global mean land-ocean temperature change from 1880-2010, relative to the 1951-1980 mean. The black line is the annual mean and the red line is the 5-year running mean. The green bars show uncertainty estimates. Source: NASA GISS
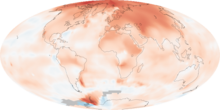
The map shows the 10-year average (2000-2009) global mean temperature anomaly relative to the 1951-1980 mean. The largest temperature increases are in the Arctic and the Antarctic Peninsula. Source: NASA Earth Observatory [1]
Climate model projections summarized in the 2007 IPCC report indicate that the global surface temperature is likely to rise a further 1.1 to 6.4 °C (2.0 to 11.5 °F) during the 21st century.[2] The uncertainty in this estimate arises from the use of models with differing sensitivity to greenhouse gas concentrations and the use of differing estimates of future greenhouse gas emissions. An increase in global temperature will cause sea levels to rise and will change the amount and pattern of precipitation, probably including expansion of subtropical deserts.[5] Warming is expected to be strongest in the Arctic and would be associated with continuing retreat of glaciers, permafrost and sea ice. Other likely effects of the warming include more frequent and intense precipitation events, extreme weather events, species extinctions due to shifting isotherms, and changes in agricultural yields. Warming and related changes will vary from region to region around the globe, though the nature of these regional changes is uncertain.[6] As a result of contemporary increases in atmospheric carbon dioxide, the oceans have become more acidic, a result that is predicted to continue.[7][8]
The scientific consensus is that anthropogenic global warming is occurring. This finding is recognized by the national science academies of all the major industrialized countries and is not rejected by any scientific body of national or international standing.[9][10][11][B] According to a recent Gallup poll, people in most countries are more likely to attribute global warming to human activities than to natural causes. The major exception is the U.S., where nearly half of the population (the largest percentage of any country) attributes global warming to natural causes.[12]
The Kyoto Protocol is aimed at stabilizing greenhouse gas concentration to prevent a "dangerous anthropogenic interference".[13] As of November 2009, 187 states had signed and ratified the protocol.[14] Proposed responses to global warming include mitigation to reduce emissions, adaptation to the effects of global warming, and geoengineering to remove greenhouse gases from the atmosphere.
Temperature changes
Evidence for warming of the climate system includes observed increases in global average air and ocean temperatures, widespread melting of snow and ice, and rising global average sea level.[15][16][17][18] The most common measure of global warming is the trend in globally averaged temperature near the Earth's surface. Expressed as a linear trend, this temperature rose by 0.74 ± 0.18 °C over the period 1906–2005. The rate of warming over the last half of that period was almost double that for the period as a whole (0.13 ± 0.03 °C per decade, versus 0.07 °C ± 0.02 °C per decade). The urban heat island effect is estimated to account for about 0.002 °C of warming per decade since 1900.[19] Temperatures in the lower troposphere have increased between 0.13 and 0.22 °C (0.22 and 0.4 °F) per decade since 1979, according to satellite temperature measurements. Temperature is believed to have been relatively stable over the one or two thousand years before 1850, with regionally varying fluctuations such as the Medieval Warm Period and the Little Ice Age.[20]Recent estimates by NASA's Goddard Institute for Space Studies (GISS) and the National Climatic Data Center show that 2005 and 2010 tied for the planet's warmest year since reliable, widespread instrumental measurements became available in the late 19th century, exceeding 1998 by a few hundredths of a degree.[21][22][23] Current estimates by the Climatic Research Unit (CRU) show 2005 as the second warmest year, behind 1998 with 2003 and 2010 tied for third warmest year, however, “the error estimate for individual years … is at least ten times larger than the differences between these three years.”[24] The World Meteorological Organization (WMO) statement on the status of the global climate in 2010 explains that, “The 2010 nominal value of +0.53°C ranks just ahead of those of 2005 (+0.52°C) and 1998 (+0.51°C), although the differences between the three years are not statistically significant…”[25]
Temperatures in 1998 were unusually warm because the strongest El Niño in the past century occurred during that year.[26] Global temperature is subject to short-term fluctuations that overlay long term trends and can temporarily mask them. The relative stability in temperature from 2002 to 2009 is consistent with such an episode.[27][28]
Temperature changes vary over the globe. Since 1979, land temperatures have increased about twice as fast as ocean temperatures (0.25 °C per decade against 0.13 °C per decade).[29] Ocean temperatures increase more slowly than land temperatures because of the larger effective heat capacity of the oceans and because the ocean loses more heat by evaporation.[30] The Northern Hemisphere warms faster than the Southern Hemisphere because it has more land and because it has extensive areas of seasonal snow and sea-ice cover subject to ice-albedo feedback. Although more greenhouse gases are emitted in the Northern than Southern Hemisphere this does not contribute to the difference in warming because the major greenhouse gases persist long enough to mix between hemispheres.[31]
The thermal inertia of the oceans and slow responses of other indirect effects mean that climate can take centuries or longer to adjust to changes in forcing. Climate commitment studies indicate that even if greenhouse gases were stabilized at 2000 levels, a further warming of about 0.5 °C (0.9 °F) would still occur.[32]
Source : wikipedia


Tidak ada komentar:
Posting Komentar